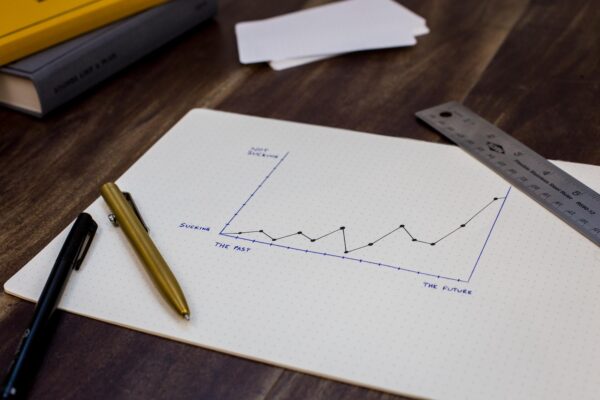
Introduction:
In the world of trading and investing, making accurate predictions about market trends is crucial for success. While it’s impossible to predict the future with certainty, technical analysis offers a powerful framework for analyzing historical market data and making informed predictions. In this blog, we will explore the power of technical analysis and how it enables traders to predict market trends using data-driven techniques.
Understanding Technical Analysis:
Technical analysis is a methodology used by traders to analyze past price and volume data of financial instruments, such as stocks, currencies, and commodities. Instead of focusing on fundamental factors like company earnings or economic indicators, technical analysis concentrates solely on historical market data. By studying charts, patterns, and indicators, traders can identify trends, potential reversals, and market sentiment.
Key Components of Technical Analysis:
- Price Charts: Price charts display the historical price movements of an asset over time. Different types of charts, such as line charts, bar charts, and candlestick charts, provide visual representations of price patterns and trends. Analyzing these charts is a foundational step in technical analysis.
- Trend Identification: Identifying trends is a primary objective of technical analysis. Trends can be classified as uptrends (rising prices), downtrends (falling prices), or sideways movements (consolidation). Traders use trend lines, moving averages, and other indicators to spot and confirm trends, allowing them to align their trading strategies with the prevailing market direction.
- Support and Resistance Levels: Support and resistance levels are price levels at which an asset tends to encounter buying or selling pressure. These levels act as psychological barriers, impacting the supply and demand dynamics. Identifying support and resistance levels is vital in predicting potential price reversals or breakouts.
- Indicators and Oscillators: Technical analysis employs various indicators and oscillators to gain further insights into market trends. Examples include the Relative Strength Index (RSI), Moving Average Convergence Divergence (MACD), and Bollinger Bands. These tools help traders assess overbought or oversold conditions, measure trend strength, and identify potential entry or exit points.
Predicting Market Trends:
- Pattern Recognition: Technical analysis involves the identification of chart patterns that provide clues about future price movements. Patterns such as head and shoulders, double tops, triangles, and flags often precede trend reversals or continuations. By recognizing these patterns, traders can anticipate market behavior and make informed trading decisions.
- Breakouts and Support/Resistance Levels: Technical analysis pays close attention to breakouts, which occur when an asset’s price moves beyond a key resistance or support level. Breakouts can indicate significant shifts in market sentiment and often lead to strong trending movements. Traders use breakouts as entry points or to confirm existing trends.
- Trend Reversals: Technical analysis aims to identify potential trend reversals. Reversal patterns, such as double tops/bottoms or head and shoulders, indicate a change in market sentiment. By recognizing these patterns and analyzing volume and other indicators, traders can predict potential trend reversals and adjust their trading strategies accordingly.
- Multiple Timeframe Analysis: Technical analysis considers multiple timeframes to gain a comprehensive view of market trends. Traders analyze shorter-term charts for precise entry or exit points, while also considering longer-term charts to understand the broader market context. This multi-timeframe analysis helps identify both short-term and long-term trends.
Conclusion:
Technical analysis is a powerful tool that empowers traders to predict market trends using historical price and volume data. By understanding price charts, identifying trends, recognizing support and resistance levels, and utilizing indicators and oscillators, traders gain valuable insights into market behavior.


